Prometheus is a network monitoring software to make sure the servers and services that you set up continue to run on your network. Monitoring can be a part of your home Raspberry Pi network!
To get started, go to the Prometheus website https://prometheus.io/download/ and use the pulldowns to find the server software. I’m going to install it on an RPi4, so I choose “linux” and “armv7”. If you’re planning on different hardware, adjust accordingly. Right-click on the blue “prometheus-2.33.0.linux-armv7.tar.gz” link and copy it.
Now, ssh to your server. Next, create a non-root user to run the server.
useradd -m -s /bin/bash prometheussudo to the new user and wget software from the link you just copied.
root@prometheus:~# su - prometheus
prometheus@prometheus:~ $ wget https://github.com/prometheus/prometheus/releases/download/v2.33.0/prometheus-2.33.0.linux-armv7.tar.gz
 --2020-12-29 15:13:26--  https://github.com/prometheus/prometheus/releases/download/v2.33.0/prometheus-2.33.0.linux-armv7.tar.gz
 HTTP request sent, awaiting response… 200 OK
 Length: 59186922 (56M) [application/octet-stream]
 Saving to: ‘prometheus-2.33.0.linux-armv7.tar.gz’
 prometheus-2.33.0.linux-armv7.tar.gz           100%[=================================================================================================>]  56.44M  16.6MB/s    in 4.2s
 2020-12-29 15:13:31 (13.5 MB/s) - ‘prometheus-2.33.0.linux-armv7.tar.gz’ saved [59186922/59186922]
Untar the distribution and move into prometheus’s home:
tar xvfz prometheus-2.33.0.linux-armv7.tar.gz
mv prometheus-2.33.0.linux-armv7/* ~
rm -rf prometheus-2.33.0.linux-armv7*
After that, create a new ‘data’ directory that will be used as a ‘tsdb’ storage.
mkdir -p ~/datacd to the ~ directory and just run the binary:
prometheus@prometheus:/home/prometheus# ./prometheus
 level=info ts=2020-12-29T20:19:05.640Z caller=main.go:322 msg="No time or size retention was set so using the default time retention" duration=15d
(shortened)
 level=info ts=2020-12-29T20:19:05.699Z caller=main.go:694 msg="Server is ready to receive web requests."
So far, so good. It runs. Keep in mind that we’re just running this in the shell. We’ll need to create a unit file to make sure that this is running as a service.
Prometheus Unit File
Exit the prometheus account and switch to root. Create a new file in /lib/systemd/system/prometheus.service. The content should be as follows: (You’ll need to exit out of prometheus’ account to get back to root in order to have the privileges to edit in this directory.)
[Unit]
Description=Prometheus Server
Documentation=https://prometheus.io/docs/introduction/overview/
After=network-online.target

[Service]
User=prometheus
Restart=on-failure
ExecStart=/home/prometheus/prometheus \
  --config.file=/home/prometheus/prometheus.yml \
  --storage.tsdb.path=/home/prometheus/data

[Install]
WantedBy=multi-user.target
Next, start and enable your new service. (You’re still root, right?)
systemctl daemon-reload
systemctl start prometheus
systemctl enable prometheus
systemctl status prometheus
The default configuration in “prometheus.yml” just monitors itself. Great. Let’s add some more hosts (or targets) to the config and then we can look at installing the agent on those hosts.
Adding Prometheus Targets
The base config is pretty simple. Let’s grab the end of the file that contains the targets, rip out the comments, and copy it for each new target:
scrape_configs:
 - job_name: 'prometheus'
 static_configs:
 - targets: ['localhost:9090']
This is the end of the yml file on the server. Copy, paste, and edit. You can see where the hostnames change in each paragraph in the example:
scrape_configs:
 - job_name: 'prometheus'
 static_configs:
 - targets: ['localhost:9090']

 - job_name: 'salt'
 static_configs:
 - targets: ['salt:9090']

 - job_name: 'mons'
 static_configs:
 - targets: ['mons:9090']
This is a yml file, so leading spaces have meaning! Be careful! I’ve effectively added two more hosts, salt and mons! Now, we need to get the agent installed on each of those hosts.
Installing the Prometheus Agent on New Targets
Head back to the Prometheus website, https://prometheus.io/download/ and scroll down a little further to node-exporter. This is the basic agent that scrapes and reports on machine info. Make sure you’ve got the pulldown set for your target hardware type.
Same routine, right click>copy the link and then wget the software on the desired node. You can just untar it and run it, but it probably makes sense to put together a salt script to install the proper version for the hardware on which it’s getting installed and then create a control script to run it. (Watch for upcoming posts!) Saltstack is optional, but we are going to need a unit script to keep the agent running. Here’s a basic unit file that you can customize to your liking. Copy this text into /lib/systemd/system/node_exporter.service:
[Unit]
Description=Node Exporter
[Service]
User=node_exporter
Group=node_exporter
ExecStart=/opt/node_exporter $OPTIONS
[Install]
WantedBy=multi-user.target
Probably best to create a user and group to run the exporter.
useradd --no-create-home --shell /bin/false node_exporterThen enable the new service file:
sudo systemctl daemon-reload
sudo systemctl start node_exporter
sudo systemctl status node_exporter
sudo systemctl enable node_exporter
Done! You’ve got the server running and the exporter running on two targets as a service!
Once you have Prometheus installed on your Raspberry Pi and have the agent deployed to a couple of other devices, you’re probably going to want to start taking a look at how Prometheus is seeing things! Using your browser, go to:
http://prometheus:9090/
And you should hit the main Prometheus page:
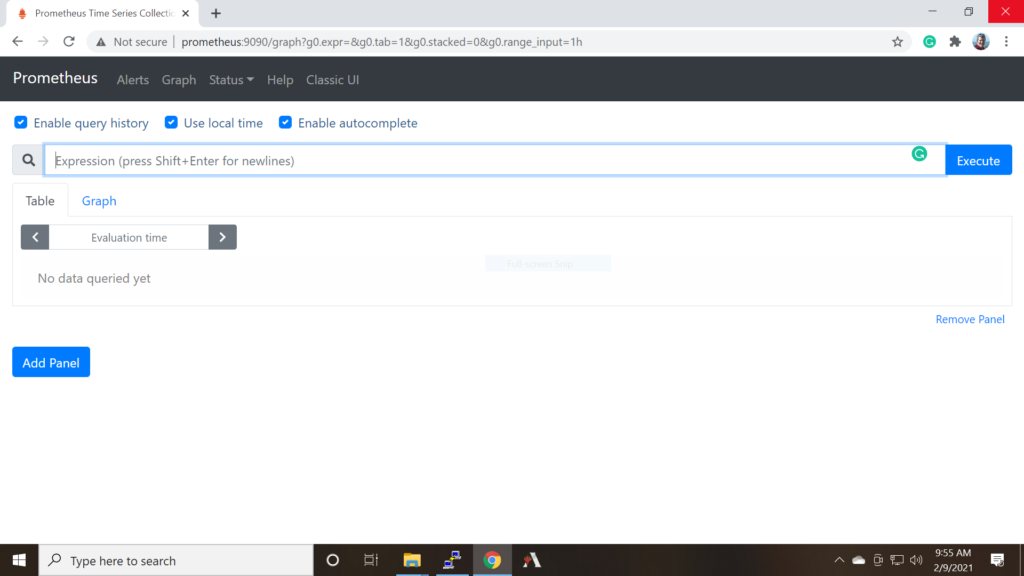
Kind of sparse, sure, but we’re getting there! Poke around a little bit. Click “Graph” and then enter:
rate(prometheus_tsdb_head_chunks_created_total[1m])
in the Expression field. Click “Graph” (in blue, next line down), and you’ll get a little graph of the data blocks that Prometheus is creating as it scrapes the hosts we’re monitoring. Check out the various reports offered in “Status” on the menu bar.
This is all lovely, but the real fun is creating graphs in Grafana! Prometheus is just a data collecting tool. Grafana is where the cool stuff is buried.